I occasionally use Siege to benchmark stuff. It's a super-quick way to do some scalability testing and find out if your application can stand up to some load. It can also help you identify slow pages and bottlenecks in the application. Recently I wanted to find out where a toy I'm making hockeysticks - that is, where the graph of request time / concurrent requests curves sharply upward.
To do this, I ran Siege ten times, stepping up the number of concurrent requests logarithmically. I set an option in my ~/.siegerc file to log all runs of siege to a file in my home directory, and it gave me a nice csv log output file. Unfortunately, headers were not included! And it didn't match the single-run output for siege. So I had a bunch of numbers, and no real indication of what they meant. I searched for documentation, but came up empty-handed. So I dug through the source code and found out. Here's the breakdown:
| date | total requests | elapsed time (sec) | bytes (MB) | avg response time (sec) | req / sec | bytes / sec (MB / s) | total time / elapsed time | successes | failures |
| 2010-11-19 13:23:22 | 125 | 59.44 | 0 | 0.01 | 2.10 | 0.00 | 0.02 | 125 | 0 |
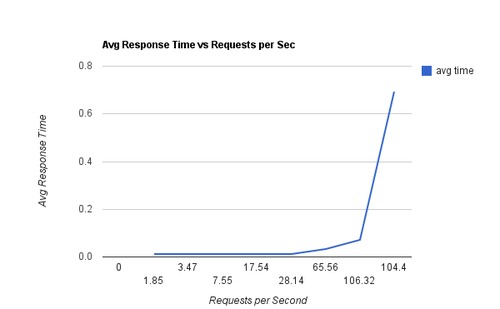
As you can see from the graph, the important numbers here are requests per second and average response time.